In order to produce a report, we have to work to some specification which will guide our design and final output.
It is not just about digging around for the right data, but how we logically present this, after all, lots of data on its own can sometimes be difficult to read and interpret. So layout is important. We produce a report with the reader in mind.
Report Requirement:
Produce a report that shows all the equipment on a per site basis. This should include the equipment name, model, and status. Furthermore, the reader must first see some mapping details and a floor plan. On this front page we also need the latitude and longitude details. In a header there needs to be the name of the report and the site name and your company logo. This report is to be available from the Site object.
Building the Site and Equipment Report
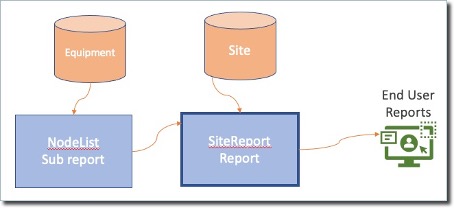
In this example we will be creating two reports: one master report (SiteReport) and one sub report (NodeList) – the following screen shot shows how they will be combined

Having followed the steps in the previous chapter for the initial creation of SiteReport,
▪Click on the Designer tab, where we will build the report. We will address the other two tabs later.
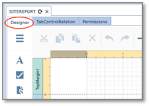
Figure 26 - Design Tab
Binding a Report to a Data Source
Now we must bind this report to a data source, and in this case the data source is Site. Later on we will see how to also bind individual control fields to their particular sub-sets of Site data.
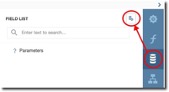
▪Click on the Field List icon followed by the Add New Data Source icon as in Figure 27
▪Then in the drop-down list locate and select Site as your data source.
▪Now save your work by clicking on the Main Menu icon followed by the Save option

Figure 27 -Report Data Source Binding
Now we have to create some form of link between the data source and IMS, so that when we run this report, for example, in a Site object instance, the data retrieved from the data source is relevant to the site instance in which we are running the report against.
For this linking, we use the Parameters option in the Field List panel as follows:
▪Click on the + button
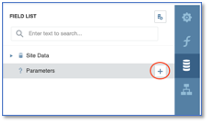
Figure 28 - Field List Parameters
▪This opens up the Add Parameter popup window
Fill in the following details:
▪Name : SiteId
▪Description: Site Id parameter
▪Type: Number (32 bit integer) – matching the data source

Figure 29 - Add Parameter
▪Click the OK button
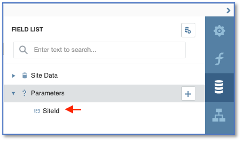
Confirm your new parameter name, as in the following screenshot you can see SiteId under the Parameters option
Now we need to complete the SiteReport’s data properties by adding the Data Member called Site
▪Navigate to the Properties panel, select your report from the search field, select the Actions option, then select the Data Member drop down option, and locate and choose the Site item from the list.
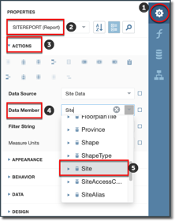
Figure 30 - Properties, Data Member, Site
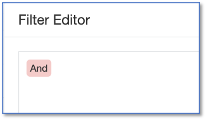
We will now create a data filter in order to restrict the resulting data to the one Site object instance where this report is launched from, as opposed to retrieving every single Site data
▪Locate the Filter String item in the Properties pane as before, under the Data Member item you just completed.
![]()
▪Click on the ellipsis icon to reveal the Filter Editor popup window where we will build the filter
▪Mouse-over the And operand and click on the green + icon.
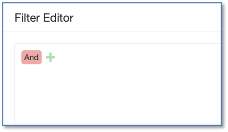
▪Select Add Condition from the dropdown values
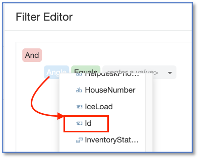
▪Click on the blue field rectangle and locate and select the Id field from the data source
▪Click on the yellow field rectangle and its down arrow icon, and select the Parameter option from the dropdown list given
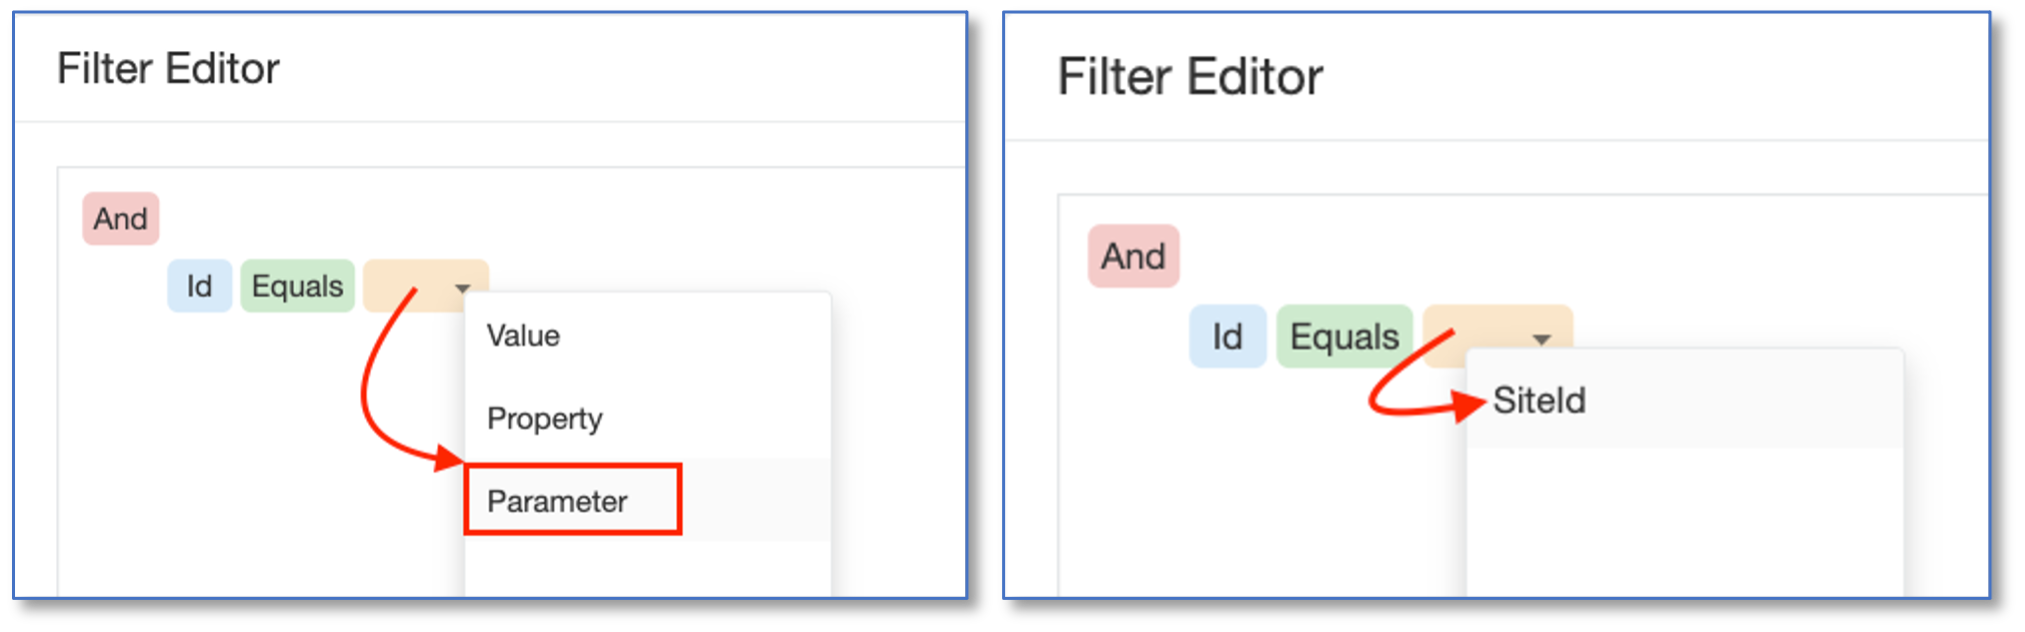
▪Click on the yellow field rectangle and select the Parameter name that you created earlier called SiteId
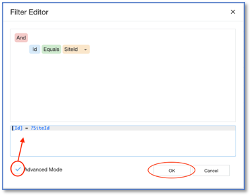
▪Click on the Advanced Mode tick box option to reveal the coded syntax that will be used by the reporting tool. This shows the matching (equals) filter criteria
▪Click OK to continue
You can now observe the results of your data binding activities in the Properties pane
Figure 31 - Data Actions
▪Go ahead and Save your work done so far from the Main Menu icon.
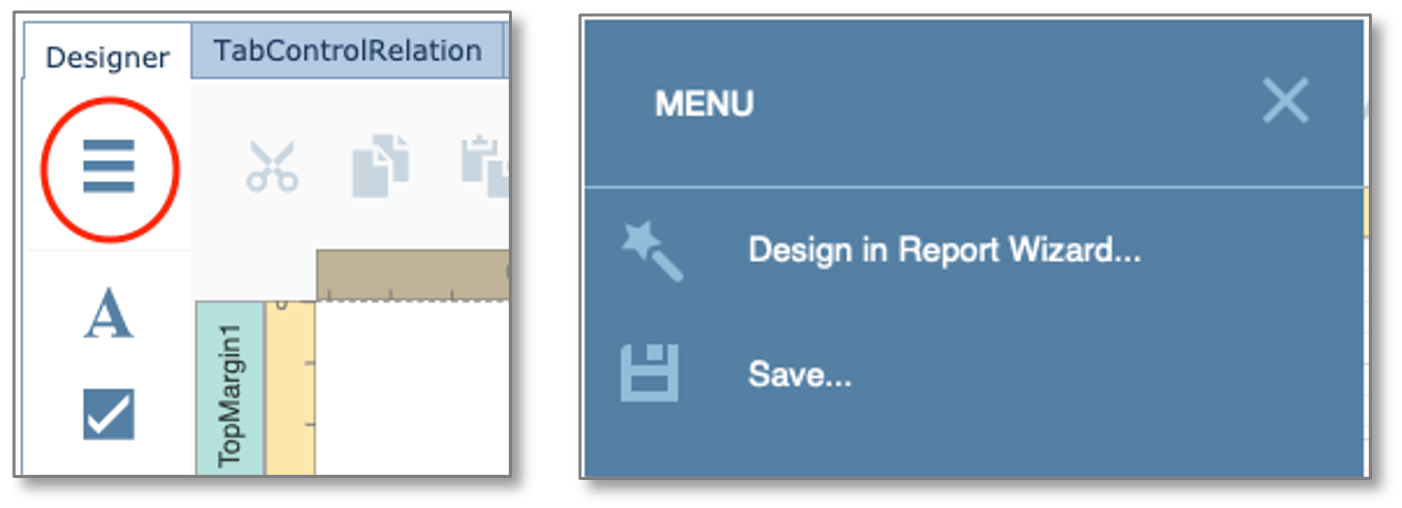
Figure 32 - Main Menu & Save
|
We will be building two separate reports and linking them together. The list of equipment in a site will become a subreport to our SiteReport |
Permissions and Tab Control Relation
There are some final points to address before we move onto the next chapter.
Permissions
First up we need to assign specific IMS users and their permissions to this report.
▪Locate the Permissions Tab, find your UserGroup Name from the first column, then enable all three tick boxes so that you can perform View, Update, and Delete actions on your report
▪Remember to click on Save changes – bottom right corner
▪You can also Preview changes before Saving them if you want

Figure 33 - Main Menu & Save
In this example I am an ADMIN user and have given myself all 3 privileges.
Tab Control Relation
Now we will associate this report to an IMS object, in this example it is the Site object, in which this report will be run.
▪Locate the TabControlRelation Tab, which is next to the Permissions Tab you were in.
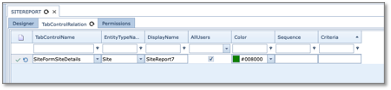
Figure 34 - Main Menu & Save
▪Click on the New icon
We want this report to be run from the Site object, and for this we need the Site object’s tab control name.
The following will show 2 methods of obtaining the Site’s TabControlName.
|
For the TabControlName field that you will need shortly, you can search for this through the drop down options given, or if you are uncertain of the TabControlName needed for the Site object then navigate to a Site object instance (in IMS) and <Ctrl + Left Click> on any of the existing tabs of information, which will cause a popup window with relevant detail that we need. See figure 35 below. |
Method 1 – from the Site object

Figure 35 - Locating the Tab Control
▪Fill in the following information, much as in Figure 35 above:
oTabControlName: SiteFormSiteDetails
oEntityTypeName: Site
oDisplayName: SiteReport<your team number>
oAllUsers: Tick this
oColor: <choose a colour for the tab>
Method 2 – from the TabControlRelation tab
▪After clicking on the New icon, as mentioned above, select the dropdown arrow in the TabControlName column
▪Locate and select the required object’s form details name (in our case, SiteFormSiteDetails)
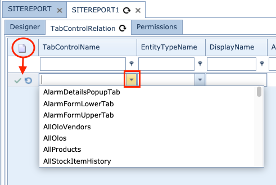
Figure 36 - Form Details Location
Whichever method you chose, make sure you have SiteFormSiteDetails in the first column entry.
▪For the EntityTypeName column, select Site from the dropdown list
▪For the DisplayName type in SiteEquip<your team number>
▪Tick the AllUsers option for training and learning purposes
▪Color: select the band of color to appear on your tab (optional)
Designing the Top Margin bar
Now that we have taken care of the top level data source, data member, parameter, and filter, we will now go ahead and build our report, making use of the Top Margin and Detail bands.
▪Drag and drop 3 Label items onto the TopMargin band as in Figure 37
▪double clicking on each item, rename 2 of them
oSite Equipment Report – this will become the report title.
oSite Name – this is just a label for the actual Site Name data
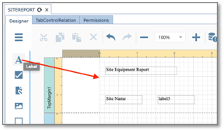
Figure 37 - TopMargin with 3 report controls
Binding the Site Control Field to a Data Source
▪In the paired Site Name label (label3 in this example) select it and then go to the Properties Panel and
o click on the property marker on the TEXT element property (red arrow in Figure 38)
oSelect Text Expression – this opens up the Expression Editor popup window
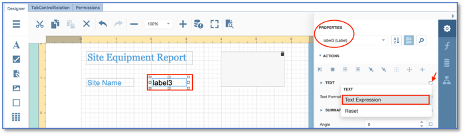
Figure 38 - Site name data binding
oNow you have two options for locating the data source for this field as explained in Figure 39 , go ahead and complete either option
oThen click on the OK button.
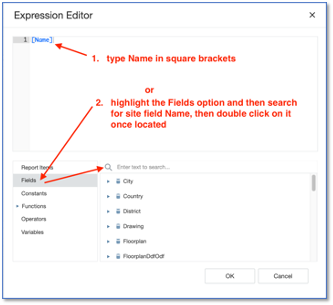
Figure 39 - Site Name Data Binding
You should now have your MarginTop bar looking something like this
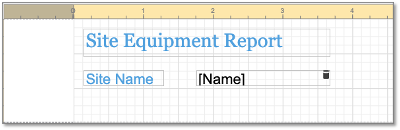
Figure 40 - Site Name Data Binding
We will now modify the look and feel of each item in the TopMargin – refer to Figure 41
▪Click on the report control labelled Site Equipment Report
▪Over on the Properties pane, label1 (Label) should be in the search bar
▪Click on the Appearance and then Font options
For this example I will just change the following characteristics: (Feel free to choose your own options)
Site Equipment report label:
oFont Name: Georgia
oSize: 20
oForeground Colour: rgba(82, 161, 222, 1)
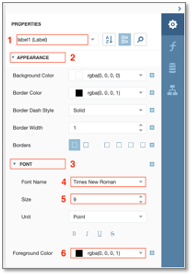
Figure 41 - Label Properties
Site Name label:
oFont Name: Arial
oSize: 15
oForeground Colour: rgba(82, 161, 222, 1)
label3 label:
oFont Name: Arial
oSize: 15
oForeground Colour: rgba(0, 0, 0, 1)
One last item to add to the TopMargin bar is a graphic, in this case I will add a simple earth logo as if it were a company logo.
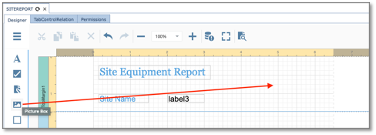
Figure 42 - Adding a Graphic
▪Drag and drop 1 Picture Box item onto the TopMargin band.
▪Prepare your logo and ensure it is of a reasonable size to fit within the Picture Box control.
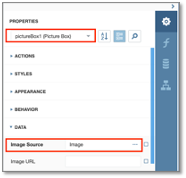
Figure 43 - Picture Box Properties
▪Navigate to the Picture Box Properties, then select the Data option to reveal the Image Source field.
▪Click on the ellipsis icon (…) and load your image, then preview the report
▪Maybe even add another label with a company name as in Figure 44
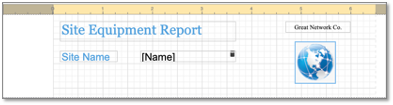
Figure 44 - Top Margin
Designing the Detail bar
For this next section we will create the following control objects in the Detail bar:
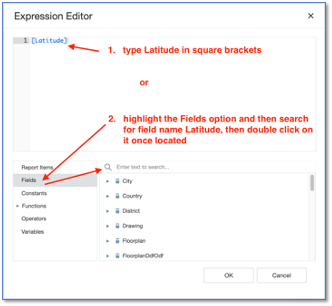
Figure 45 - Control Field Data Binding
Latitude and Longitude
GeoMap1
GeoMap2
Floor plan drawing
List of equipment (subreport)
Latitude and Longitude
▪As in the previous section, go ahead and drag 4 new Labels onto the Detail bar
▪Change the label names of two of them to read Latitude and Longitude
▪In the paired Latitude label select it and then go to the Properties Panel and
o click on the property marker on the TEXT element property (red arrow in Figure 46)
oSelect Text Expression – this opens up the Expression Editor popup window
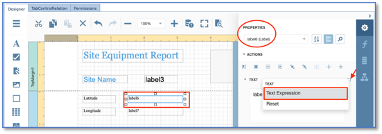
Figure 46 - Latitude Data Binding
oNow you have two options for locating the data source for this field as explained in Figure 45 earlier, go ahead and complete either option
oThen click on the OK button.
Perform the above process for the Longitude control field data binding, obviously using [Longitude] where applicable.
▪Now save your work by clicking on the Main Menu icon followed by the Save option
Geo Map Drawing
This next section will describe how to insert mapping functionality to your report.
From the Toolbox menu drag the GeoMapDrawing icon onto the Detail bar area twice.
![]()
Figure 47 - GeoMap Drawing Icon
You should end up with two geo control items as shown below in Figure 48
One item will have a road map tile, the other one will have a satellite tile
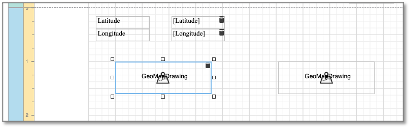
Figure 48 - GeoMapDrawing Control items
▪Click on the first GeoMapDrawing item and ensure that the properties are as follows Figure 49
oObjectId Expression: [Id] (binding it to the data source)
oObject Type: Site
oTileLayer: GoogleRoadMap (from dropdown selection)
oShowGeo: Select (tick)
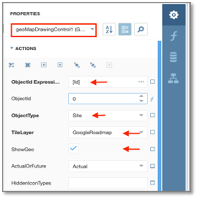
Figure 49 GeoMapDrawing Properties 1
Now we need to set the second GeoMapDrawing properties
▪Click on the second GeoMapDrawing item and ensure that the properties are as follows - Figure 50
oObjectId Expression: [Id] (binding it to the data source)
oObject Type: Site
oTileLayer: GoogleSatellite (from dropdown selection)
oShowGeo: Select (tick)
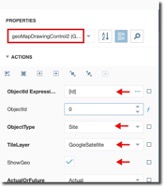
Figure 50 GeoMapDrawing Properties 2
We will now move onto the floorplan design.
Floorplan
This next section will describe how to insert the floorplan functionality to your report.
From the Toolbox menu drag the FloorplanDrawing icon onto the Detail bar area.
![]()
Figure 51 - Floorplan Icon
You should end up with a floorplan item as shown below. Resize and adjust all three items accordingly as in Figure 52
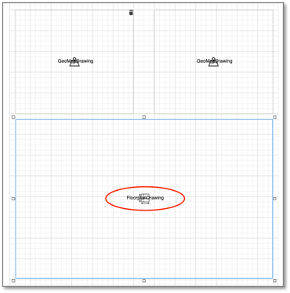
Figure 52 Floorplan Control Item
Now we need to set the Floorplan properties
▪Click on the Floorplan item and ensure that the properties are as follows Figure 53 :
oSiteId Expression: [Id] (binding it to the data source)
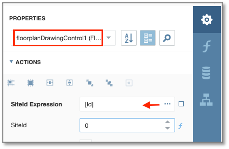
Figure 53 Floorplan Properties
We will now move onto the Sub-report design.
Sub-report - NodeList
This next section will describe how to insert the Sub-report functionality to your report.
We will create the sub report called NodeList – this sub report will be called by its parent SiteReport.
In much the same way that we designed the SiteReport, go ahead and create a separate report called NodeList.
The following screen shot is what it should look like in the Designer once complete.
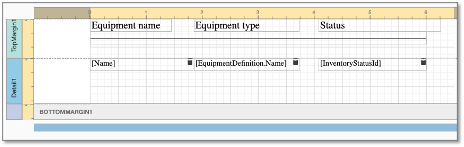
Figure 54 NodeList Report
We now complete the NodeList’s data binding activities - like we did with the previous SiteReport.
1.From the Field List section:
▪New data source – search and select Equipment from the dropdown list
▪Add a new parameter called SiteId, just like in the previous section called Binding a Report to a Data Source
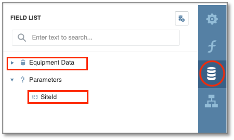
Figure 55 Field List Options Needed
2.From the Properties section, bind the 3 Control Fields to their respective data sources, using the Text Expression functionality
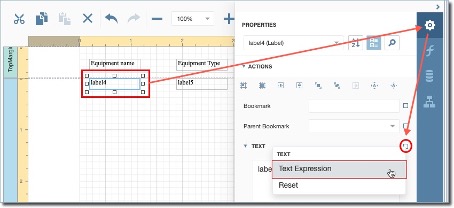
Figure 56 - Field Data Binding
For each of the 3 data control fields, and in their respective popup Expression Editor windows, type in their values - including the square brackets as per the table below:
|
Equipment Name |
Equipment Type |
Status |
Text Expression |
[Name] |
[EquipmentDefinition.Name] |
[InventoryStatusId] |
Example below given for the Equipment Name data control field in the Expression Editor popup window:
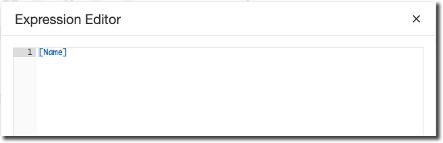
Figure 57 - Expression Editor
Now save your work – by clicking on the Main Menu icon and select the Save option.

Figure 58 Main Menu - Save
Now we go back to the SiteReport design.
Completing the Sub-report functionality.
Bring up your SiteReport design again.
▪From the Toolbox menu drag the Sub-report icon onto the Detail bar area.
![]()
Figure 59 - Sub Report Icon
▪Set the Sub-report control properties as we have done before for other control fields as in Figure 60:
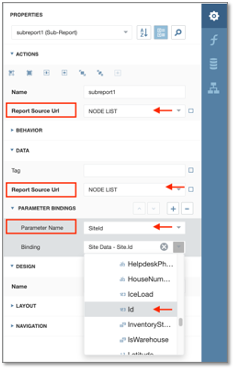
Figure 60 Sub-report Control Properties
oReport Source Url: NodeList
oParameter Name: SiteId
oBinding: Site Data – SiteId
We will also add a title to the Sub-report with a label
▪From the Toolbox menu drag the Label icon onto the Detail bar area
▪Double click on the Label and type in ‘List of Equipment at this Site’
You should end up with a Sub-report section as shown below. Resize and adjust the Sub-report and its title under the Floorplan item accordingly as in Figure 61
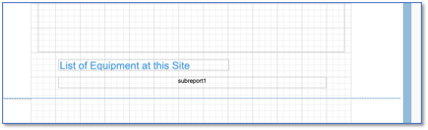
Figure 61 - Sub-report
▪Now save your work – by clicking on the Main Menu icon.

Figure 62 - Main Menu
This concludes the basic design and structure of your SiteReport showing what equipment is present.
You can of course tweak the look and feel of it, for example you might want to format labels differently with sizes and colours or even re-arrange fields around with a different layout on screen.