In this exercise we will create a new dashboard report in which we will chart the number of Nodes by City name.
Overview
In this example we will:
i. |
Produce a grid (table) that displays circuit names with their corresponding customer or department name, speed, connectivity status, and created date (year) |
ii. |
Produce a filter mechanism (combo box) in which to group data results by product name and connectivity status |
iii. |
Conditional formatting - highlight all circuit created dates that are older than the year 2016 |
iv. |
Rename various titles and column names |
As before:
▪From the Dashboard Actions tab, click on the Create New option to open up a new Designer pane
▪Amend the Permissions tab options as required for this report
▪At this point, go ahead and save your work as before
▪Back on the Designer tab (now containing your new dashboard name)
▪Click on the Grid icon in the toolbox and drag it onto the Designer pane.

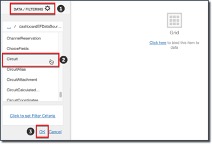
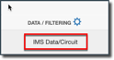
In the same way we did in a previous exercise, go ahead and bind this new dashboard to the Circuits data as in the following 2 screen shots:
▪Confirm the data binding
▪Click on the Designer background (containing the Grid) to open up the Grid setting menu
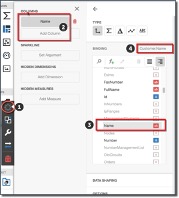
1.Select the Binding option
2.Add a new Column – click on the Add Column item
3.Locate and select Customer, then Name in the list of binding data sources
4.Confirm your selection by verifying your result next to the Binding title
▪Close the Binding section by clicking on the title “Binding” (screenshot below)
▪Now open the Options section just below, so that we can rename the column title to something meaningful – refer to the next screenshot:
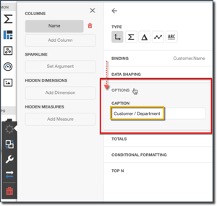
▪Rename the Caption to Customer / Department
Go ahead and do the same by adding 4 more columns, as we just did, with the following information, all from the base Circuit data source:
▪Name - (rename caption to Circuit Name)
▪Speed - (rename caption to Speed Name)
▪InventoryStatusId - (rename caption to Connectivity Status)
▪CreateDate - (rename caption to Created Date: Red - if Older than 2016)
Conditional Formatting
For the created date column, we will implement a conditional format in which the year value is to turn red (or any colour of your choice) if the year is older than 2016.
▪Starting from the grid menu, click on the Binding icon
![]()
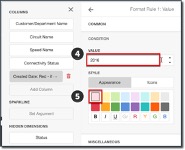
▪From the following 3 screen shots, follow the sequence of 5 steps:
1.from the grid Columns section, select the Created Date field
2.then select the Conditional Formatting option
3.Select Value from the given list
4.Type in 2016 in the field space provided
5.Select a red colour option – in this case a light red or pink

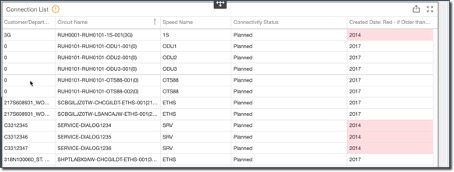
▪Close the grid menu and validate your work.
You should notice that all rows whose dates are 2015 and earlier will have their date fields highlighted in the colour of your choice
Now we will move onto the final piece of this exercise – the filter mechanism.
Filter mechanism – Combo Box
In this section we will introduce another component to our dashboard report. Let’s assume that the requirement is to filter our circuit results set to be grouped by Circuit Product and Connectivity Status.
We will start as follows:
▪Select the Combo Box item from the Filter group and drag it onto the Dashboard (this screenshot already shows the combo box with a modified title … we will get to that part shortly)
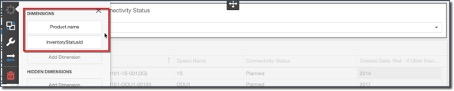
▪As before, go ahead and add two data source fields to the Dimensions group by clicking on the Add Domain buttons - as shown in the following screenshot
oProduct.Name
oInventoryStatusId
▪Rename the Caption of this Combo Box to something meaningful
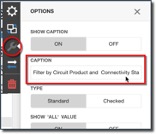
▪Close the Options menu
▪and Save your work
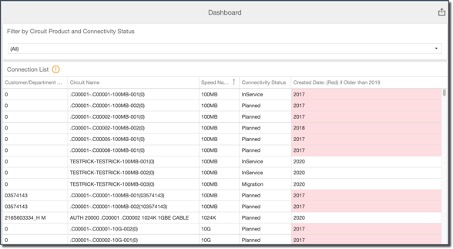
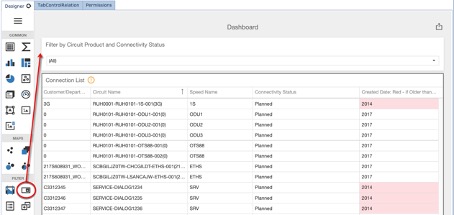
Your Dashboard should now look similar to the following screenshot

You should now be able to test the filter mechanism by selecting an entry from the dropdown list provided
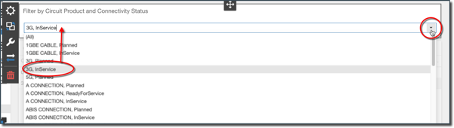
Having made a selection – in this case 3G, InService – you should now see a reduced data set based upon your filter criteria
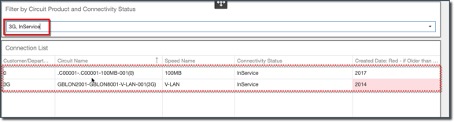
This now completes this exercise.