A grid is a table view in a form.
Below some functions that might be useful to know.
Filter row option in grids
Users can use the "filter row" on top of the grid to filter or search specific data.
The filter text can be entered in the filter text, see red high-light.

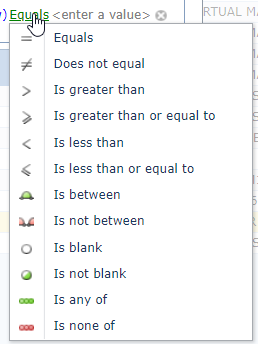
To change the filter type, the small symbol right of the filter text field can be clicked to select the filter option.
See blue high-light. The options are:
Begins with |
finds data that starts (so seen from the left) with the text in the filter |
Contains |
finds data that contains the text in the filter regardless where |
Doesn't contain |
finds data that does not contain the text in the filter |
Ends with |
finds data that ends (so seen from the right) with the text in the filter |
Equals |
finds data that exactly matches the text in the filter |
Doesn't Equal |
finds data that exclude all results that exactly matches the text in the filter |
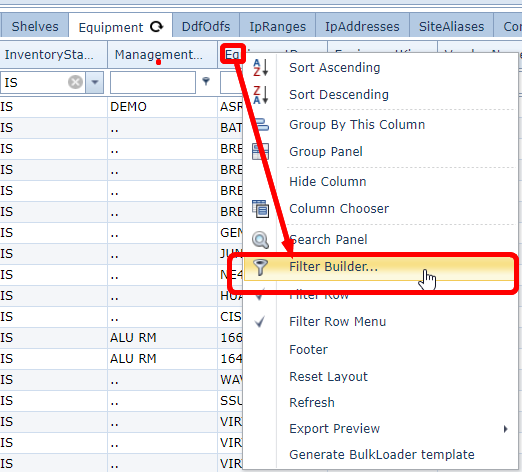
Filter Builder option in grids
More complex filters can be created via the "Filter Builder" option.
This filter option can be opened via the right mouse menu option on a field header, see screenshot:
After selecting a pop-up menu appears.
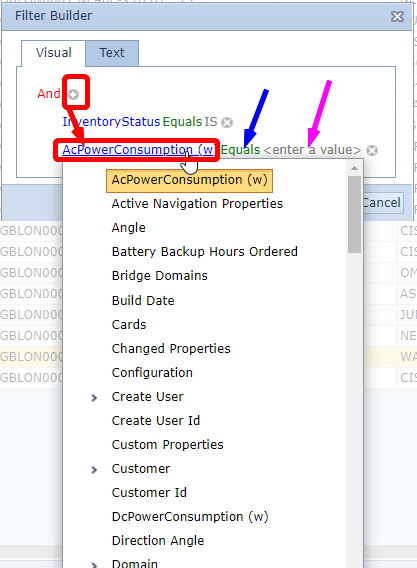
The filter that was already in place will become visible.
On the left it will say AND or OR in red with a (+).
Highlighted in red:
The (+) can be used to add more filter fields.
Once the (+) is pressed a new field will appear that is related to that table, it will find the first field
using the alphabetic order. To change this into another field, click on the field and chose the correct one.
The green fields (blue arrow) can be used to change the filter type:
Then the filter text must be added, which can be done via the <enter a value> field (pink arrow).
Group by Column
Another way to look at the date is when the data is grouped by a specific field.
This option is called "Group By This Column".
Right click on a field name header and chose option "Group By This Column", see screenshot:
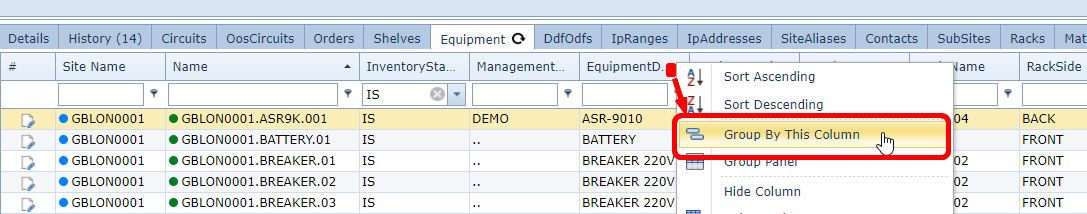
This results in a grid/table view that groups the data per value of the field you have grouped.
Example:
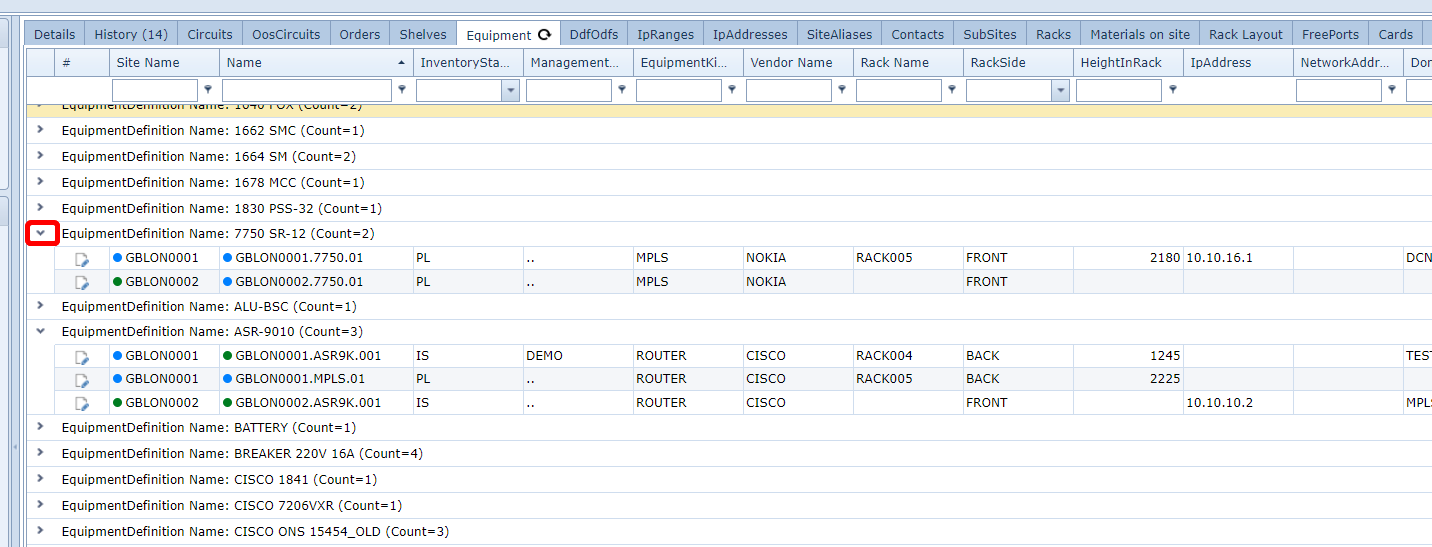
Data can be made visible (or not visible) via the icon on the left (see red).
To made the grouping undone, right click on any field header and select option: "reset layout".
Export to Excel and CSV
The data visible in the grid can be exported to excel or CSV.
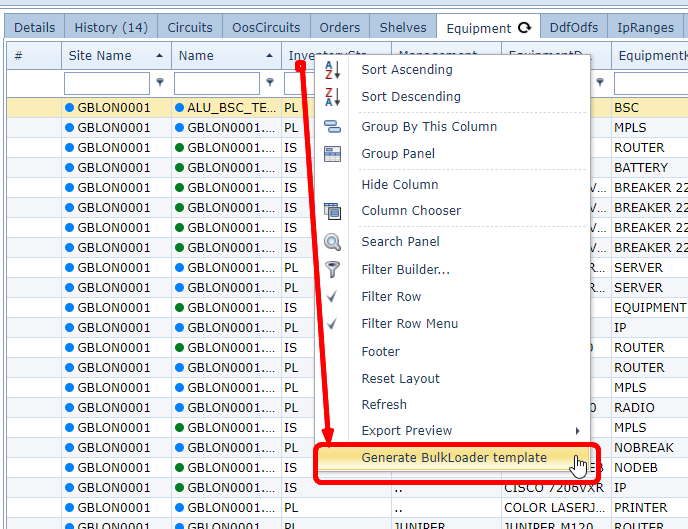
This can be done via right mouse button menu on any field header, see example screenshot:

The file will be uploaded to your machine, you will find it at the left bottom of your screen.
Generate Bulkloader
A nice feature is to create bulkloaders with existing data. This will help you to do mass changes on existing data
or use the exported data to understand how to fill in a bulkloader for new data.
To generate the bulkloader template, first find the data in the grid you need to have a bulkloader.
For example:
- if you want to create new customers:
- go to customer form
- find all customers,
- filter the grid so that it only consists of data you need.
- generate bulkloader template
- if you want to create new connections:
- go to any grid with list of connection, for example:
- site form, tab "connections"
- node form, physical ports tab
- speeds form, correct speed, circuits tab
- filter the grid so that it only consists of data you need.
- generate bulkloader template
For further explanation, please see chapter "Bulkloader".