This section covers the following points:
➢Introduction
➢Accessing and Creating Polygons
➢Opening a Polygon
Introduction
Polygons are a convenient way to visually see areas of the network where certain activity is being carried out or about to be.
Some use cases are:
➢To indicate an area that is owned by other businesses and serving as an example, say, not to dig up ground in case of damage causing disruption and legal implications.
➢Areas that notify or warn that something is going on - like a planned work or network maintenance, government work etc.
➢They can serve to indicate service areas - which areas cover fiber and which only cover copper.
➢Fiber to the home areas can be grouped by Splitters (equipment) serving those customers.
➢Polygons also provide detailed information regarding all the various IMS objects that fall in those areas.
➢They can be used to show district boundaries.
Accessing and Creating a Polygon
Creating a Polygon starts with drawing the shape first and then saving the work when done.
If you do not see this icon |

▪Start by opening the required Network Map
▪From the Network Map feature bar select the Draw Option icon (Pencil) and then Polygon from the drop down list - the mouse pointer now has a blue dot.

▪Place the mouse pointer on the starting location of the polygon on the map and left click
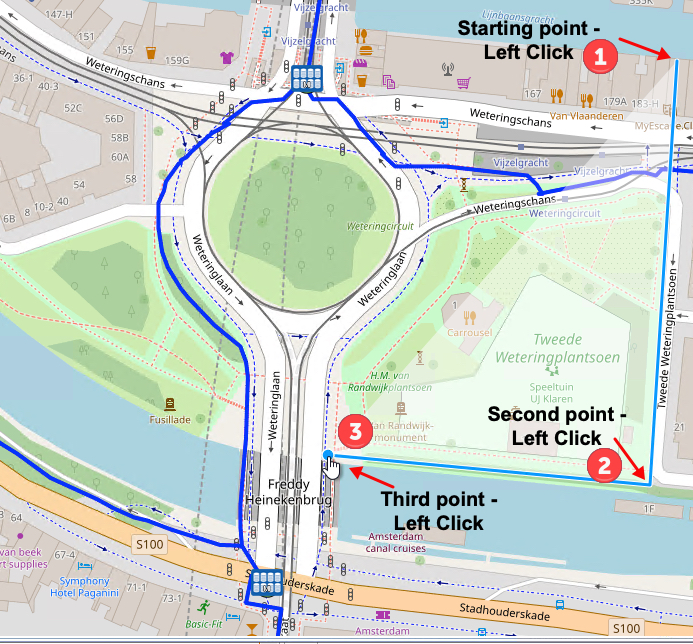
▪Select the second point on the map and left click, notice the blue line drawn in between click points
▪Repeat these steps until you double left click on the starting point, which will complete the shape and colour it in (red).

▪From the Network Map feature bar select the Save Drawbuffer option icon which opens up the New Polygon popup window

▪Fill in the the fields of information accordingly, especially the mandatory ones
▪Click on the Save icon to finish - lower left corner

Polygon Form Fields
Polygon Type |
User defined field to categorize polygons i.e., by a zone, project, technology, etc. |
Name |
User defined name for this Polygon |
Comments |
User defined comments for this Polygon |
Color |
The colour to represent the area of this Polygon - semi-transparent tones |
Site |
Relate a polygon to draw the contour of the building of the site |
Order |
Linking to an Order/TT instance - i.e., new fiber roll-out plan |
Map |
Select the map to associate this Polygon to. Although not a mandatory field, if it is not selected the polygon will not show in the required map |
Node |
Link a Polygon to a Node that has been planned only, where the exact location in area is yet unknown |
OloProduct |
The Olo Product that this Polygon refers to |
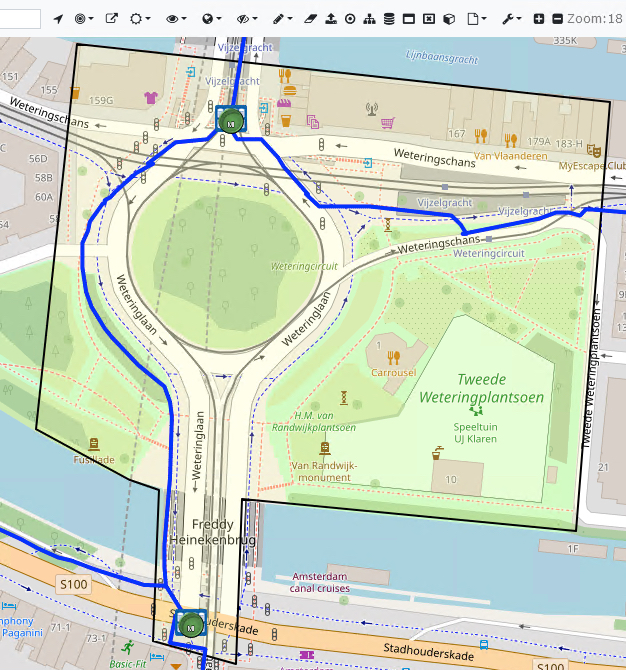
▪The end result should look like this:
Opening a Polygon
Opening a Polygon allows the user to view all related IMS objects and data associated with that polygon.
The first step is to:
▪From the Network Map feature bar select the Draw Option icon and then Edit Polygon from the drop down list

This step also allows for the reshaping of the Polygon by left clicking on the polygon and dragging any of the click points (white circles) to the desired location. |
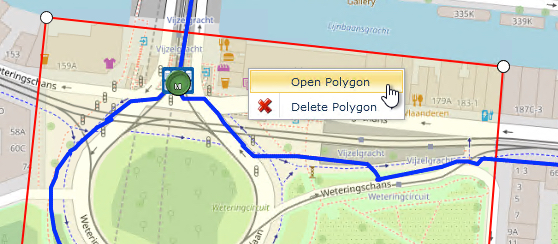
▪Right click on the Polygon to reveal a small popup window and select the Open Polygon from the list
This opens up the Open Polygon form to reveal several tabs of information which includes all related IMS Objects under the current Polygon area. In the screen shot below Sites, Nodes, Circuits and Sub Circuits, and DDF/ODFs are associated to this geographical area.
