** WORK IN PROGRESS ** This section is yet to be updated to the newer version of IMS Feature location, commands, instructions, and screen shots may not appear the same if you are using a newer version of IMS |
IMS version 21.9.8 - Nov 2021
Content:
➢Accessing the Alarms Module
Introduction
When IMS is setup to interface with a network, the Alarms module displays all relevant and filtered incoming
alarms from the network in a grid format as well as displaying a graphical layout (with or without background maps).
When combined with the Reporting, a report dashboard can be associated to it as well.
Alarm management
The following table highlights some of the main points in how IMS processes incidents reported from the network:
▪ |
Alarms relating to network elements in IMS that are not in service (non active) or belong to a Planned Work instance will be suppressed |
▪ |
Root cause analysis is performed by processing incoming network alarms and finding relationships between these alarm and network elements contained in the IMS database. All related alarms are given a common root cause analysis identifier (RCAid) |
▪ |
IMS uses the Network Map to display all active alarms that are not acknowledged. The Network Map can be in Geo or non-Geo mode. |
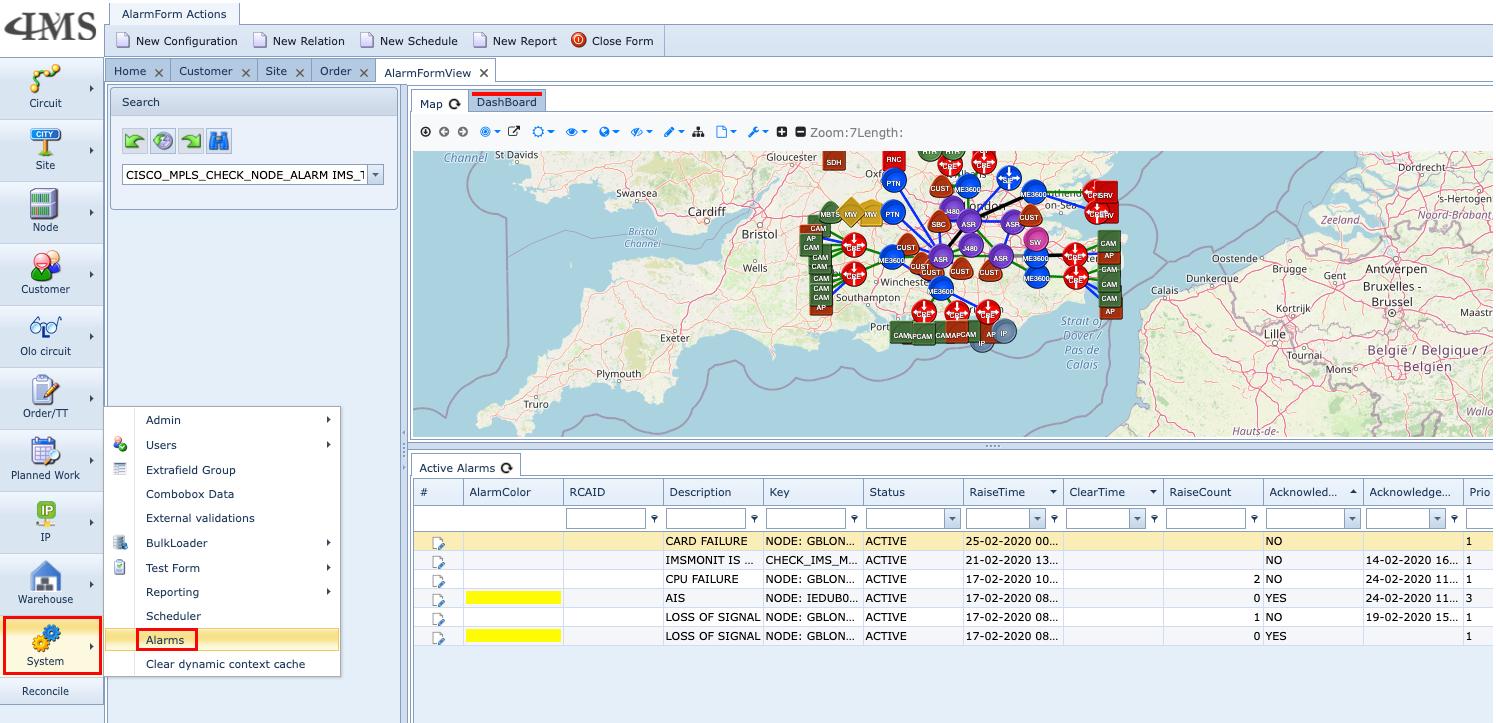
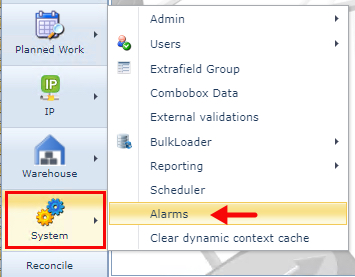
Accessing the Alarms Module
Accessing the Alarms module is through the IMS Main Menu by clicking on:
▪Systems and then Alarms option [refer to the above screenshot]
Relating alarms to IMS-data.
For Each alarm, the alarm processing engine will try to find a relation to a Node/Port/Card/Site.
When this relation is made, the operator can directly find the following related IMS data:
- Site access control list - Which engineer was on the site where the alarm took place
- Which customer services are impacted by this alarm
- History of alarms related to this object including the Trouble tickets related to previous alarms
- Full trouble ticket logging of the current alarm + the history alarms trouble ticket logging.
- A list of available spare parts, so the operator knows where to find a replacement (card/Node etc.) for this issue (If needed)
- A list of engineers who are nearest to the site where the alarm is.
In the main alarm screen, the operator can find a tab showing all planned works that are active right now.
On the active alarm list, you can find the trouble ticket related to this alarm and operator can add comments to the alarm.
A fully customizable dashboard is available in IMS but also as a separate website this dashboard (And many more) can be viewed.


Create trouble ticket from Alarm:

All related traffic to the object will be related to the Trouble Ticket.

By relating the traffic to the TT, now in the customer form users can see active trouble tickets related to the customer:

From the Trouble Ticket form in IMS, operators will find all active trouble tickets:

Alarm details:

Highlighted card :

Traffic impact:

History of all alarms previously on this object (Including related trouble ticket)

All trouble ticket loggings on current + history alarm trouble tickets:

Tab that shows Spare items in stock:

When the GPS position of the engineer is known in IMS, the following tab will also appear:
(Now the operator knows which engineer is closest to this site where the alarm is)

When site access control data is in IMS the following tab will show which engineer was in the site with what reason:

Customer service dashboard (Fully customizable):
